A Complete Betting Strategy for Horse Racing in the UK, 2026 Edition
By Horse Racing Betting Analyst

- Why Most Punters Bleed Money — and What a Real Strategy Looks Like
- Five Pillars, One Framework, the Numbers That Matter
- The State of UK Horse Racing Betting in 2026
- Strategy, System, or Tip — Which One Are You Actually Following?
- Pillar One: The Value Edge — Betting on Price, Not Horses
- Pillar Two: Disciplined Staking — Surviving the Losing Runs
- Pillar Three: Form and Data — Reading What the Racecard Actually Tells You
- Pillar Four: Market Mechanics — Understanding How Prices Get Made
- Pillar Five: Execution and Record-Keeping — Where Discipline Meets the Betting Slip
- What Favourite Win Rates Actually Tell You — and What They Hide
- Affordability Checks and the Regulatory Shift That Changed UK Betting
- Building Your First Strategy from a Blank Spreadsheet
- Seven Mistakes That Drain Bankrolls Faster Than Bad Form Reads
- Tools and Data Sources That Earn Their Place on Your Screen
- Questions I Get Asked Most About Horse Racing Betting Strategy
- A Framework That Outlasts Any Single Season
Why Most Punters Bleed Money — and What a Real Strategy Looks Like
Nine years of staring at racecards, and the single biggest lesson I have learned is this: a betting strategy is not a tip. It is not a system you copy from a forum post on a Tuesday night. A strategy is a repeatable process for identifying bets where the odds on offer exceed the true probability of the outcome — a process you can run tomorrow, next month, and next season with a positive expected return. A system is a mechanical rule («back every second favourite at Kempton»). A tip is someone else’s opinion. A strategy is yours, built on data, tested against reality, and adjusted when the market shifts beneath you.
That distinction matters more now than at any point in the past decade. The UK horse racing betting market generated GGY of 766.7 million pounds in the year to March 2025, making it the second largest remote betting vertical after football. Yet total turnover on racing fell 4.2% year-on-year through the first three quarters of 2025 and 12.8% compared with 2023. The market is large, liquid, and shrinking — which means the remaining money is concentrating among punters who understand edges, and away from those who chase hunches.
This guide lays out the five pillars I use to evaluate every bet I place on UK racing: value identification, disciplined staking, form and data analysis, market mechanics, and execution discipline. Each pillar links to a dedicated deep-dive article. Together, they form a framework that has kept me profitable across flat seasons, jumps campaigns, and one very expensive Cheltenham.
I am not selling selections. I am not ranking bookmakers. What I am doing is showing you the analytical scaffolding behind every decision I make — backed by Gambling Commission data, BHA reports, and the kind of statistics that the top ten Google results consistently fail to cite. If 7% of the UK adult population bet on horse racing during the peak summer months, and the vast majority lose, the question is not whether an edge exists. It is whether you are willing to build the discipline to find it.
Five Pillars, One Framework, the Numbers That Matter
- UK horse racing betting generated 766.7 million pounds in GGY in 2024-25, but total turnover is falling — down 4.2% year-on-year — meaning the market rewards sharper bettors and punishes casual punters more aggressively than ever.
- A strategy is not a system or a tip. It is a repeatable framework built on five pillars: value identification, disciplined staking, form analysis, market mechanics, and execution discipline.
- Favourites win 34.4% of all UK races but only 25.7% of handicaps. Where you bet matters as much as how you bet.
- The bookmaker overround of 5-20% is a hidden tax on every wager. Understanding it — and using exchanges or odds comparison to reduce it — is one of the simplest ways to improve long-term returns.
- Affordability checks now trigger at 150 pounds per month in net deposits, reshaping how and where UK punters can deploy their bankrolls.
The State of UK Horse Racing Betting in 2026
I pulled up the Gambling Commission’s annual report last week and the numbers told a story no tipster column will share with you. The remote horse racing betting sector — online and phone — brought in 766.7 million pounds in gross gambling yield for the financial year ending March 2025. That is real margin, not turnover, and it sits behind only football in the UK sports betting hierarchy. Meanwhile, the betting levy paid by operators to fund racing itself hit a record 108.9 million pounds, up from 105.3 million the previous year. On the surface, racing looks flush.
766.7M pounds
Remote horse racing GGY, FY 2024-25
108.9M pounds
Record betting levy paid to racing
-4.2%
Year-on-year turnover decline through Q3 2025
5.031M
Racecourse attendance in 2025, first time above 5M since 2019
194.7M pounds
Record total prize money in 2025

Dig deeper and the picture fractures. Total betting turnover on UK racing dropped 4.2% in the first three quarters of 2025 compared with the same period in 2024, and a full 12.8% compared with 2023. Average turnover per race fell 5.8% year on year. The BHA’s own racing report shows that Core Fixtures — the everyday bread-and-butter cards — saw turnover slide 8.6%, while Premier Fixtures, your Ascots and Cheltenhams, actually rose 2.7%. Money is migrating upward: big meetings attract more, ordinary Tuesdays attract less.
What does this mean for your strategy? Two things. First, the liquidity you rely on for exchange trading and sharp-priced value bets is thickest at Premier meetings and thinnest on a wet Monday at Plumpton. Second, the shrinkage is not random. A chunk of it traces directly to regulatory intervention — affordability checks that I will cover in detail later in this article — and that has reshaped how much money mid-stakes punters can deploy. If your strategy assumes you can always get matched at the price you want, you need to adjust for these new realities.
Racecourse attendance hit 5.031 million in 2025 — a 4.8% rise and the first time the figure has topped five million since 2019. More people are watching in person. Fewer are betting remotely. The sport is gaining fans while losing punters, a split that is reshaping everything from fixture scheduling to prize money allocation, which itself reached a record 194.7 million pounds.
The industry’s own leaders are candid about the headwinds. Richard Wayman, the BHA’s Director of Racing, put it bluntly: the horse population continues to decline and the betting environment remains challenging. The population of horses in training has been falling roughly 1.5% per year since 2022, which means smaller fields, fewer races, and more concentrated markets. For a strategic bettor, smaller fields change probability distributions in ways that generic «back the favourite» advice never accounts for. The days of assuming the UK racing product is static are over. Your strategy has to move with the market, or the market will move your money for you.
Strategy, System, or Tip — Which One Are You Actually Following?
A mate of mine once told me he had a «strategy» for the Grand National: back anything grey, because «greys always run well at Aintree.» That is not a strategy. That is barely even a system. It is a superstition with a betting slip attached. But the confusion is everywhere, and it costs people money, so let me draw the lines clearly.
| Criterion | Strategy | System | Tip |
|---|---|---|---|
| Definition | A framework of principles for identifying positive-expectation bets across varying conditions | A fixed mechanical rule applied without judgement to a defined set of races | A single selection from someone else’s analysis |
| Adaptability | Adjusts to changing markets, going, field sizes | Rigid — same rule regardless of context | One-off, no continuity |
| Required knowledge | Probability, form, market structure, staking maths | Ability to follow instructions | Trust in the tipster |
| Longevity | Designed for years of use | Degrades as market adapts | Expires after the race |
| Accountability | You own the decisions and learn from results | Blame the system when it fails | Blame the tipster |
A system — say, «back every trainer with a 14-day strike rate above 25% in handicaps at courses where they have a positive record» — can be a useful component inside a strategy. But on its own, a system lacks the contextual judgement that separates long-term winners from people who automated a rule that worked for six months and then stopped. Systems degrade because markets adapt. If a profitable angle becomes widely known, the odds contract until the edge disappears. A strategy anticipates that. A system does not.
Expected value (EV) — the average profit or loss per bet if the same wager were placed an infinite number of times. A positive EV bet is one where the odds offered exceed the true probability of winning, meaning profit over time.
Tips have their place as data points. I follow several analysts whose work I respect, not to copy their selections but to see what form angles they are prioritising. The moment you treat a tip as a finished product — stake it without checking the price, the going, the draw, the market movement — you have handed your edge to someone who may not even track their own results rigorously. The UK hosts over 10,000 races across 362 days of the year. There is no shortage of opportunities. What is scarce is the discipline to evaluate each one through a consistent framework rather than reacting to someone else’s enthusiasm.
So throughout this guide, when I say «strategy,» I mean the whole architecture: value assessment, staking discipline, form analysis, understanding how prices are made, and the record-keeping that lets you refine the process over time. Five pillars, not one lucky hunch.
Pillar One: The Value Edge — Betting on Price, Not Horses
Early in my career I backed a horse called something forgettable at Newbury. It won at 5/1. I felt like a genius. Then I looked at my spreadsheet a month later and realised I had backed 40 horses that month at similar prices and the net result was a 12% loss. The winner was not skill. It was noise. What changed everything for me was a shift in thinking: stop asking «will this horse win?» and start asking «is this horse’s price too high for its actual chance of winning?» That is value betting in one sentence, and it is the foundation of every profitable approach I have ever built.
Value exists when the odds offered by a bookmaker or exchange imply a lower probability than the horse’s actual chance of winning. If you assess a horse has a 25% chance (fair odds of 4.0) and the market offers 6.0, that is a value bet — regardless of whether it wins or loses on the day. Over hundreds of bets, consistently finding positive expected value is the only mathematical path to profit.
The concept sounds simple. The execution is not. You need two skills: estimating true probability better than the market, and understanding where the market systematically misprices. The data is revealing. Blind bets on favourites lose at roughly 5.5% on investment. Bets at odds between 4.0 and 16.0 lose at roughly 18%. Blind bets on horses ranked ninth or tenth in the market lose above 40%. This is the favourite-longshot bias in action: the further down the market you go, the worse the return. Estimating a horse’s true probability to within a few percentage points is hard, and any error can flip a perceived value bet into a losing proposition. I cross-reference form, speed ratings, going preferences, trainer intent, and market movement before concluding a price is too generous. The deep mechanics live in the dedicated guide on finding value bets in horse racing.

What matters at the pillar level is the mindset shift. Most punters bet on outcomes. Strategic bettors bet on prices. The horse does not know you backed it. The price is the only thing you control, and the only thing that determines whether your long-term ledger trends up or down.
Pillar Two: Disciplined Staking — Surviving the Losing Runs
The best value bettor I know went broke in 2019. Not because his selections were wrong — his long-term strike rate was solid and his average odds were healthy — but because he staked 10% of his bankroll on each bet and hit a run of 14 consecutive losers in a fortnight. At level stakes of 10%, fourteen losses in a row wipes out 77% of your bank. He could not recover psychologically, chased the remaining funds into bad bets, and was done within a month. The edge was real. The staking was fatal.
That story sits at the core of why staking is a pillar, not an afterthought. Your bankroll is your inventory. Without it, your analytical skill is worthless. Every staking plan exists to answer one question: how do I size my bets so that normal variance — the losing streaks that hit every winning bettor — does not destroy me before the edge has time to compound?
What a losing run looks like in practice
Start with a 1,000 pound bankroll. Your long-term strike rate is 22% at average odds of 5.5, giving you a positive expected value of roughly 21% on turnover. Sounds excellent.
But at a 22% strike rate, runs of 10+ consecutive losers are statistically normal over a season. If you stake 5% per bet (50 pounds), ten straight losers cost you 500 pounds — half your bank. If you stake 2% per bet (20 pounds), the same ten losers cost 200 pounds and you still have 800 pounds to work with.
The mathematical edge is identical in both scenarios. The survival rate is not. Staking at 2% gives you runway. Staking at 5% gives you anxiety.
If you specialise in value at bigger prices, your strike rate will be low and your losing runs long. Level stakes, proportional staking, and the Kelly Criterion each handle this differently. Level stakes keep things simple. Proportional staking scales with your bank. The Kelly Criterion maximises long-term growth but is aggressive enough that most professionals use quarter or half Kelly to smooth the ride. The full treatment — with worked examples and variance modelling — lives in the bankroll management guide. At the pillar level: if you do not have a written staking plan you follow without exception, you do not have a strategy. You have a hobby with a leak.
One critical point for exchange users: lay betting and dutching strategies introduce liability rather than a fixed stake. Lay a favourite at 3.0 for 20 pounds and your liability is 40 pounds, not 20. Misunderstanding this has bankrupted more exchange newcomers than bad form reading ever will.
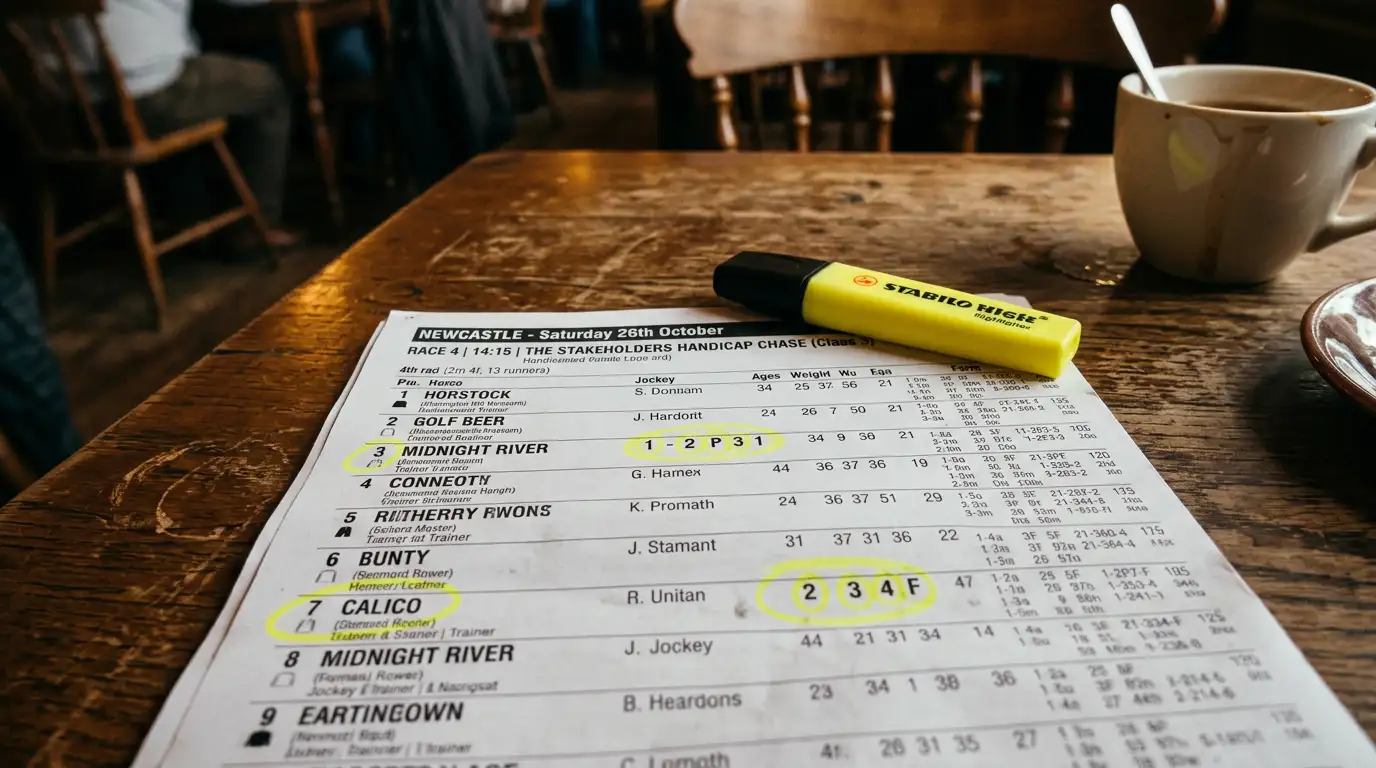
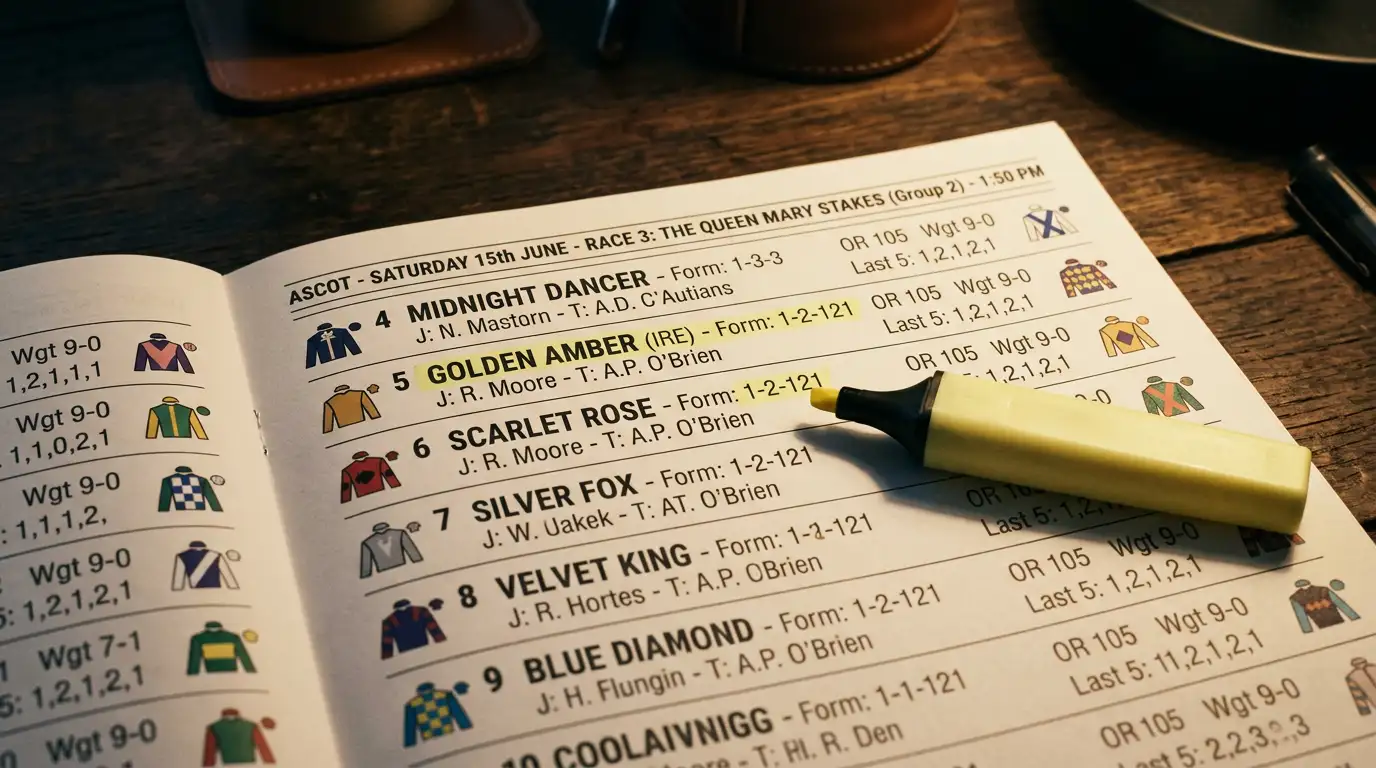
Pillar Three: Form and Data — Reading What the Racecard Actually Tells You
There is a moment, maybe thirty minutes before a race, when I am sitting with a coffee and a racecard and everything else falls away. The numbers on that card — finishing positions, official ratings, weight carried, days since last run, going description, course and distance record, trainer form — are compressed information. Each line is a story. The skill is reading the story faster and more accurately than the market has priced it.
Form analysis is the process of interpreting a horse’s race history — encoded in sequences of numbers and letters on the racecard — to estimate its current ability and likely performance under today’s specific conditions. It is not about finding «the best horse» in a race; it is about finding the horse whose ability, relative to its price, offers the greatest discrepancy.
Raw data without context is noise. A horse showing form figures of 1-2-1 looks brilliant until you notice those runs were in Class 6 sellers and today it is jumping into a Class 4 handicap off a 9lb higher mark. Conversely, 0-5-7 might reflect Group company runs, with the horse now stepping into a conditions race where it towers over the field. Context comes from understanding the hierarchy: Class 1 down to Class 7, conditions versus handicaps, turf versus all-weather, hurdles versus chases.
Speed figures, official ratings, going preferences, draw statistics by course, trainer and jockey metrics — these are layers you stack on top of the basic form read. Each one sharpens your probability estimate by a small margin. Stack enough together and you start to see what the market has missed. The full methodology — decoding every racecard symbol, weighting different rating systems, knowing when recent form trumps long-term ability — lives in the dedicated guide on reading horse racing form. At the pillar level, form reading is not optional. It is the engine powering every other part of your strategy.
One warning: form analysis is seductive. You can spend hours on a single race and convince yourself you have found an edge when all you have found is a narrative confirming your initial hunch. I guard against this by assigning a probability before I look at the price. Odds first means anchoring; analysis becomes rationalisation. Probability first, price second. Always.
Pillar Four: Market Mechanics — Understanding How Prices Get Made
I once watched a horse drift from 3.5 to 6.0 on the exchange in the final ten minutes before the off. No news, no going change, no jockey switch. Just money leaving the market. I backed it at 5.8, it won by two lengths, and I collected a price nearly double what the morning tissue suggested. That trade was not about form analysis. It was about understanding market mechanics — the invisible machinery that moves prices — and being positioned to exploit a dislocation when it appeared.
| Feature | Traditional bookmaker | Betting exchange |
|---|---|---|
| Your counterparty | The bookmaker | Another punter |
| Built-in margin | 5-20% overround depending on field size | No overround; 2-5% commission on net winnings |
| Laying (betting against a horse) | Not available | Core feature |
| Price formation | Set by traders, adjusted by liability | Supply and demand from users |
| Account restrictions for winners | Common | Rare — exchange profits from turnover |
The single most important number most punters never learn is the bookmaker overround. In a fair market, implied probabilities across all runners sum to 100%. In practice, a UK race typically carries 105-120%. That excess is the bookmaker’s margin. A six-runner race might carry a 108% book. A 20-runner handicap might carry 118%. Every penny of that excess comes from your pocket.
Overround in action
Five runners priced at 2.5, 4.0, 6.0, 8.0, 12.0. Implied probabilities: 40% + 25% + 16.7% + 12.5% + 8.3% = 102.5%. A tight 2.5% overround. Now a 16-runner handicap at 115%: you are paying 15% in embedded margin before your form analysis even matters.
Exchanges replace the bookmaker with peer-to-peer matching and charge commission on net winnings — roughly 2-5% on profit rather than 5-20% on every bet. The difference is enormous over hundreds of bets. Comparing prices across two or three accounts typically improves returns by 2-5%, simply by refusing to accept the first price you see. Market movement adds another dimension: a horse shortening from 10.0 to 6.0 signals informed money arriving; a drift from 4.0 to 7.0 means support evaporating. Understanding what movement implies about information flow gives you a timing advantage pure form analysis cannot.
The full breakdown of odds formats, overround calculation, exchange mechanics, and Best Odds Guaranteed lives in the dedicated odds and market structure guide. The pillar-level takeaway: the price is not just a number. It is a product with a margin, shaped by money flow, and your job is to understand the margin before you accept the product.
Pillar Five: Execution and Record-Keeping — Where Discipline Meets the Betting Slip
I have a spreadsheet with over 11,000 rows. Each row is a bet I have placed since 2018: date, course, race type, horse, estimated probability, price taken, stake, result, profit or loss, and a notes column where I flag anything unusual — a late going change, a jockey switch, a market move I misread. That spreadsheet is more valuable than any tipster subscription, any software tool, any racing database. Because without it, I would have no idea which parts of my strategy actually work and which parts I am just telling myself work.
Execution is the unsexy pillar. Nobody wants to hear about logging bets, reviewing monthly P&L by race type, or admitting that their «edge» in National Hunt chases has actually been a 6% loss over 400 bets. But this is where profitable betting is built. External pressures — from affordability checks to account restrictions — make discipline even more critical. If your available bankroll is constrained, every bet has to justify its place in the portfolio.
Pre-bet checklist I run before every wager
- Have I assigned a probability estimate before looking at the price?
- Does the available price exceed my estimated fair odds by a meaningful margin?
- Is the going confirmed and consistent with this horse’s preference?
- Have I checked for non-runners that change the race dynamic?
- Does my stake comply with my written staking plan?
- Am I betting because the analysis supports it, or because I want action?
- Have I logged the bet with all fields before moving on?
That last question catches me most often. The desire for action — the itch to have something running in the 3:15 even when nothing passes the filter — is the most corrosive habit in betting. I have days where I review six meetings and place zero bets. Those days protect my bankroll for the one race on Thursday where the value is screaming. The record is the mirror. Look in it regularly, and fix what it shows you.
What Favourite Win Rates Actually Tell You — and What They Hide
Every guide on the internet says «favourites win about 35% of the time.» I have seen that claim on at least eight competitor sites, and not one of them cites a source, a sample period, or a race-type breakdown. The number is approximately right as a blunt average but almost useless for making betting decisions, because the variance within that average is where all the strategic information lives.

34.4%
Favourite win rate across all UK races over the past five years
25.7%
Favourite win rate in handicap races specifically
55-60%
Win rate for odds-on favourites on the flat
86%
Win rate for favourites priced at 1.25 or shorter
Look at the spread. An odds-on favourite in a flat maiden wins 61% of the time. The same market position in a competitive handicap wins 25.7% of the time — nearly two and a half times less frequently. A favourite priced at 1.25 or shorter wins 86% of the time, which sounds wonderful until you realise that at those odds you need to win roughly 80% of the time just to break even. The margin for error is razor thin, and one stumble wipes out four winners’ worth of profit.
The second and third favourites tell an equally important story. Second favourites win 18-21% of races. Third favourites win roughly 12-15%, with a return on investment hovering around minus 15%. Combine the top three in the market and they account for 65-70% of all UK race winners. That means roughly a third of all races are won by something the market ranked fourth or lower. For a value bettor, that one-third is the hunting ground — but it is also the zone where the favourite-longshot bias is strongest, and blind bets on outsiders lose at rates exceeding 40%.
So what do you do with these numbers? Three things. First, if you are going to back favourites, do it in race types where the favourite win rate is structurally highest — maidens, small-field conditions races, Group events — and avoid backing them in open handicaps where the field is most competitive. Second, if you are looking for value against the favourite, handicaps are where the maths works in your favour, precisely because the market leader loses three quarters of the time. Third, never back a longshot simply because the price is big. The data is emphatic: the longer the odds, the worse the return, unless your independent analysis has identified a specific mispricing.
These numbers are not decorative. They drive how I allocate my time. I spend more minutes analysing a 16-runner handicap where the favourite is 4/1 than a five-runner Group 1 where the favourite is 4/7, because the handicap is where analysis has the highest marginal return.
Affordability Checks and the Regulatory Shift That Changed UK Betting
If you started betting seriously before August 2024, the landscape you knew no longer exists. The UK Gambling Commission launched financial vulnerability checks — commonly called affordability checks — that require operators to assess a customer’s ability to sustain their gambling spend. The initial threshold was 500 pounds in net deposits per month. By February 2025, it tightened to 150 pounds per month for enhanced checks. Cross that threshold and your operator may request payslips, bank statements, or other evidence of affordability before allowing you to continue depositing.
The impact on turnover has been severe. Total UK horse racing betting turnover dropped 9% in the first quarter of 2025 compared with the prior year. Since 2022, the industry estimates roughly three billion pounds in cumulative lost turnover. Core Fixtures saw a 14.4% decline while Premier Fixtures held roughly stable — suggesting that mid-level bettors, not high-rollers at marquee events, are bearing the brunt of the restrictions.
Richard Wayman was direct about the cause: he has no doubt that affordability checks have driven people to either stop betting or move their money to unlicensed operators where no such checks exist. Grainne Hurst, CEO of the Betting and Gaming Council, called those unlicensed operators parasites who pay no tax, ignore safer gambling requirements, and contribute nothing to the levy. The debate is politically charged, but the practical consequence for you as a bettor is straightforward: your deposit capacity may be capped, your account may face verification delays, and the overall market liquidity you rely on — especially on smaller meetings — is thinner than it was two years ago.
The BHA has modelled the potential damage from further regulatory tightening. Their economic analysis suggests that harmonising online betting tax rates could cost racing 66 million pounds in its first year and 330 million over five years, putting an estimated 2,752 jobs at risk across the industry. Whether those projections hold or not, the direction of travel is clear: the regulatory environment is getting tighter, not looser, and any strategy that ignores this context is incomplete.
What does this mean practically? First, if you run a bankroll above the threshold levels, anticipate that you will need to provide documentation. Build that into your planning rather than treating it as a surprise. Second, consider maintaining accounts on both traditional bookmakers and exchanges to diversify your access — if one operator restricts your account, you are not locked out entirely. Third, accept that some of the turnover decline is permanent. The liquidity in mid-tier races will not return to 2022 levels under the current regime, and your staking and timing need to account for thinner markets on everyday cards.
Building Your First Strategy from a Blank Spreadsheet
The year I started keeping proper records, I made a discovery that embarrassed me. I had been telling myself I was a «handicap specialist.» My results said otherwise: across 280 handicap bets, my ROI was minus 8%. Where I was actually profitable was in small-field flat conditions races — a segment I had been treating as an afterthought. Without the data, I would have kept pouring money into the wrong race types for another year. The spreadsheet did not lie. My self-image did.

So here is how I would build a strategy from scratch today, knowing what nine years of trial and error have taught me. The process has four phases, and rushing any of them is the fastest way to lose money while feeling productive.
Phase 1: Choose a niche and study it deeply
Pick one race type — handicap flat races, National Hunt chases, all-weather sprints — and spend two to four weeks studying it without placing a single bet. Read form, watch replays, note patterns.
Phase 2: Develop a probability model
Estimate each runner’s win probability before looking at the odds. After four weeks, compare your estimates against starting prices to calibrate. Most people skip this entirely.
Phase 3: Paper trade
Record 100 hypothetical bets with prices and stakes. Calculate ROI, strike rate, and longest losing run. If the numbers are positive and the losing runs survivable, you have a candidate strategy.
Phase 4: Go live with minimum stakes
Place 200 real bets at the smallest stakes your plan allows. The purpose is testing emotional discipline, not making money. Can you follow the plan through seven losers in a row?
The temptation is to skip to Phase 4 because paper trading feels like a waste of time. It is not. The information you gain about calibration accuracy, emotional triggers, and race-type biases is worth more than whatever you might have won or lost with real stakes during those weeks. Your first strategy will not be your best — it will be a first draft, and the record-keeping from Pillar Five exists so you can iterate.
Seven Mistakes That Drain Bankrolls Faster Than Bad Form Reads
I have made every one of these. Some of them more than once. The reason I list them here is not to lecture — it is because I genuinely believe that eliminating mistakes produces better returns than finding new edges. A strategy with a 5% edge and clean execution beats a strategy with a 10% edge and sloppy discipline every time, because the sloppiness compounds against you in ways that the edge cannot overcome.
Do
- Accept that every bet is an independent event — the last result has no influence on the next outcome
- Set a daily maximum number of bets and stick to it regardless of results
- Compare odds across multiple accounts before placing every bet
- Define your quitting criteria for a losing session in advance
- Treat the last race of the card with the same analytical rigour as the feature — or skip it
Don’t
- Chase losses by increasing stakes after a losing run
- Stake more on the last race of the card to «get back to even»
- Ignore the bookmaker overround and accept the first price you see
- Follow a tipster’s selections without verifying the price is still available
- Confuse a winning streak with proof that your strategy is sound — small samples lie
Chasing losses is the classic. You are down 80 pounds, the 4:30 has a «good thing,» and you stick 40 on instead of your usual 15. I cured this with a hard rule: three losses in a row and I walk away for the day, because my decision quality deteriorates after that point.
Ignoring the overround is subtler but equally costly. A 5/1 shot in a 106% book is a very different proposition from 5/1 in a 118% book — the embedded tax is nearly three times higher. And the last-race trap catches even disciplined bettors: you are tired, attention is fragmented, and the race is often a low-grade affair with limited form. If nothing passes your filter, close the laptop. The next card is tomorrow.
Tools and Data Sources That Earn Their Place on Your Screen
When I started out, I used a paper notebook and a borrowed Racing Post. Now my setup runs across three screens and six data sources. But the principle has not changed: every tool must serve one of the five pillars, or it is clutter.
Form databases
The foundation. You need access to comprehensive race results, form figures, speed ratings, and trainer/jockey stats going back at least three years. Several UK-based providers offer this at subscription and free tiers. The depth of historical data matters more than the interface.
Odds comparison tools
Using two to three accounts to compare prices routinely improves returns by 2-5% versus betting with a single operator. Odds comparison sites show you the best available price across the UK market in real time. This is free, takes ten seconds, and is one of the highest-return habits you can adopt.
Exchange platforms
Essential for lay betting, back-to-lay trading, and accessing markets without the bookmaker overround. The exchange also shows you where the smart money is going through price movements and volume data.
Speed figures, sectional times, going data, draw statistics by course and distance, and trainer 14-day form are all available through UK racing data providers. Some are free; some require a subscription. The test is whether the data feeds directly into your probability estimation process. If it does not change the numbers in your model, it is entertainment, not analysis.
A spreadsheet — or a dedicated betting-log application — is the tool I consider most non-negotiable. Your bookmaker’s history page does not let you segment results by race type, odds range, going, or course. A properly structured log does. The fields I track: date, course, race class, race type, horse name, estimated probability, odds taken, stake, result, P&L, going, notes. That is twelve columns. It takes thirty seconds per bet to fill in. The insight it returns after 500 bets is worth more than any piece of software.
One tool I deliberately do not use is automated betting bots. Not because they are illegal under UK rules, but because they remove me from the decision-making process. My edge comes from contextual judgement that a rules-based system cannot replicate. If your edge is purely mechanical, automation makes sense. If it relies on synthesising qualitative and quantitative inputs, a bot strips out the judgement that creates the edge.
Questions I Get Asked Most About Horse Racing Betting Strategy
What is the most profitable betting strategy for horse racing in the UK?
There is no single «most profitable» strategy because profitability depends on your probability estimation skill, staking discipline, and specialisation. The data consistently shows that value betting — finding prices that exceed the true probability of an outcome — is the mathematical foundation of every approach that has sustained long-term positive returns. Strategies built on probability assessment and rigorous record-keeping have a structural advantage over mechanical systems because they evolve with the market.
How often does the favourite actually win in UK horse racing?
Across all UK races over the past five years, the market favourite has won approximately 34.4% of the time. But that average masks enormous variation. Odds-on favourites on the flat win 55-60%. In handicap races, the favourite wins only about 25.7%. Favourites priced at 1.25 or shorter win 86% of races, but the margins at those prices are so thin that a single loss erases multiple winners. The race type and price range matter far more than the blunt average.
Is it realistic to make a living from horse racing betting?
It is possible but far harder than most people imagine. A sustainable yield of 5-10% on turnover is considered strong among professional UK bettors. A 5% yield on 100,000 pounds of annual turnover produces 5,000 in profit — not a salary. Add account restrictions from bookmakers, affordability check constraints, and the psychological toll of extended losing runs, and the barrier to entry is very high. Most people who attempt it treat it as supplementary income rather than a full-time replacement.
Why do I need a staking plan at all for horse racing betting?
Because even a profitable strategy will bankrupt you without one. At a 20% strike rate with average odds of 6.0, you will regularly encounter losing runs of 10-20 bets in sequence. Without a staking plan limiting each bet to a small percentage of your bankroll, those runs consume your capital before the edge compounds. A 2% per-bet limit means a 15-bet losing streak costs 30% of your bank. A 5% limit means the same streak costs 75%. Same edge, different outcome.
What is the difference between a betting strategy and a betting system?
A strategy is a flexible framework for finding positive-expectation bets across varying conditions. It adapts to changing markets, going, and field sizes. A system is a fixed mechanical rule applied without contextual judgement. Systems can be useful components within a strategy, but they degrade over time as the market adjusts to any publicly known pattern. A strategy incorporates learning. A system does not.
How do affordability checks affect UK horse racing bettors?
Since August 2024, UK-licensed operators must assess whether customers can afford their gambling spend. The current threshold for enhanced checks is 150 pounds in net deposits per month. Exceed that and your operator may request financial documentation before allowing further deposits. Total racing turnover fell 9% in Q1 2025 year-on-year, with roughly three billion pounds in cumulative turnover lost since the checks began. The practical effect is reduced deposit flexibility and potential verification delays.
Why do most punters lose money on horse racing?
The structural reason is the bookmaker overround. In every market, the implied probabilities add up to more than 100% — typically 105-120%. That excess is the operator’s margin, meaning the collective pool of bettors must lose by the size of that margin. Individual reasons compound on top: poor staking discipline, chasing losses, betting without estimating probability, and treating tips as finished products. Eliminating these behavioural errors gives your analytical edge room to operate.
A Framework That Outlasts Any Single Season
I wrote the first version of my betting framework in a notebook in 2017. It had three rules and no data. The version I use today has five pillars, over a hundred documented decision criteria, and a feedback loop that rewrites itself every quarter based on what the spreadsheet reveals. The framework survived a global pandemic that emptied racecourses, a regulatory overhaul that reshaped the deposit landscape, and a market decline that has trimmed turnover by double digits in two years. It survived because it was never about a single angle or a single season. It was about building a process that adapts.
The five pillars are not sequential. They operate simultaneously on every bet. Value assessment tells you whether to bet. Staking tells you how much. Form analysis powers your probability estimate. Market mechanics tell you where to place the bet and at what price. Execution discipline ensures you actually follow the plan rather than the emotional impulse that says «just this once, I will wing it.» Remove any one pillar and the structure collapses. A value bettor with no staking plan goes broke. A form reader who ignores market mechanics leaves money on the table. A disciplined executor with no form skills is disciplined about being wrong.
The UK horse racing market is not a casino. The BHA itself has acknowledged that betting on the sport can almost be considered a skill and is enjoyed by many as an intellectual challenge. That characterisation is accurate, and it is the reason the market rewards analytical effort in a way that roulette never will. But skill without structure is just talent waiting to be wasted. The structure is what this guide offers. The skill — the ability to read a race, estimate a probability, and hold your nerve through a ten-bet losing streak — is what you bring.
Each of the five pillars above links to a dedicated guide with worked examples, formulas, and race-card walkthroughs. Start with whichever pillar addresses your biggest current weakness, and build from there.
Creado por la redacción de «Betting Strategy for Horse Racing».